Insights & Analysis: On-Premise Sales Price Data
Taken from an article written by Economist Bart Watson, Chief Economist for the Brewers Association, his article takes a deep-dive into the pricing of North Carolina Breweries compared to breweries from California, Colorado, Florida, Georgia, and Texas. We thought it was interesting enough to share some of his numbers and perspective.
Economists like talking about prices. Unfortunately, as a trade association economist, I don’t get to talk about prices that much, since any price data other than aggregated pricing data can be seen as encouraging price-fixing among industry competitors.
That’s why I was excited to get my hands on a new set of aggregated data via the team at Arryved, a point of sale solution specifically designed for the craft brewing industry. Because they built their system for breweries, it allows an analysis of average prices specifically at brewpubs and brewery taprooms.
Arryved Point of Sale Aggregate Data
The data below only includes breweries from California, Colorado, Florida, Georgia, North Carolina, and Texas. Those are states with the most Arryved customers so there weren’t any fears about being able to identify individual breweries in the raw data, which only included a unique anonymous product identifier code, the size of the sale, the price, and any additional code, such as “happy hour,” etc. The data set is fairly large; for example, there are approximately 2,700 unique product prices for normal, non-happy hour pint prices, with more than 100 in every state listed above.
I’m hoping to spend more time digging into this data in the future, but as a first pass, I thought it would be helpful to simply present some of the data in aggregate form with some basic analysis of brewery taproom and brewpub beer pricing.
Beer Prices by Size
Let’s start with just some basics. Below are the average prices by state for the most common sizes in the system for “normal” price periods. With the exception of “Splash,” I’ve cleaned the data by removing all $0 prices.
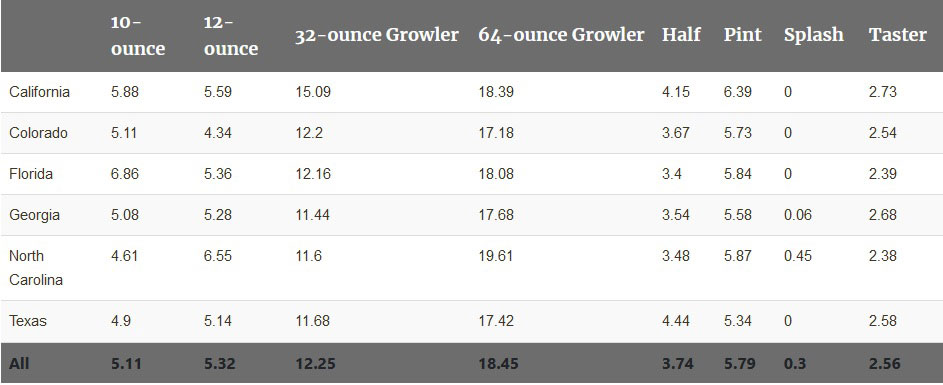
These data are already super interesting, but also show some of the limitations of this kind of really high-level analysis.
For example, why is there such a tiny gap between 10-ounce and 12-ounce pricing? Well, probably because those tend to be different beers, and breweries are pouring higher price-per-ounce beers (barrel-aged, specialty, etc.) in the 10-ounce versus the 12-ounce size.
This is where having access to all the individual data points comes in handy. By using the product codes, we can start to compare like to like and really dig into this data set.
Here’s an example: There are 1,034 unique products in the database that have both a “normal” pint and 64-ounce growler price. So we can take those cases and know that the only difference in pricing is the format – it’s the same beer in the same pricing environment.
For those beers:
- Average pint price = $5.62
- Average 64-ounce growler price = $16.75
A couple of quick follow-up thoughts…
First, you can see why this type of data that controls for product matters. The pint price is pretty similar to the overall data, but only including products available in both a pint and a growler brings the average growler price down almost 10 percent. So on average, growlers not offered in pints cost more than growlers offered in pints. We can intuit that this is likely because growlers not offered in pints (so likely offered in smaller formats) are probably higher ABV, hence the higher cost.
Second, this provides an aggregated benchmark for pricing 64-ounce growlers relative to beers offered in pints that is roughly 3:1 (2.98:1 if you want to be really precise).
Can you sense how fun this is for me?
Special Pricing Situations
Alright, I won’t be able to dive into everything I want to cover in this data set in this post (i.e. more posts coming soon), but here are three more pricing pieces that I put together on my first pass.
Charging for Splashes
You probably have lots of beer lovers who sidle up to the bar and want to try “just a splash” or “just a taste” of beers. Do you charge them for those beers? Based on the Arryved data, the answer is probably no, unless you’re from North Carolina.
Here’s the breakout of products coded as $0 versus 1 cent or more for North Carolina and every other state:
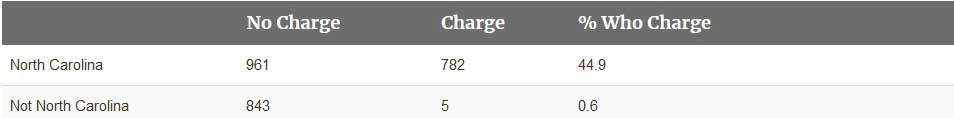
Digging in one level deeper, for those breweries who do charge for a splash, the average price is almost $1.00 exactly (99.8 cents). Is charging for splashes a good idea? Based on this data, I have no clue (hard to connect with follow-up purchases), but now you have a benchmark on average price if you want to try it.
Happy Hour
NOTE: the section below uses data from the “happy hour” code in the Arryved data, which brewers may use to signify other discount programs they have. Time specific discounts may not be legal in all the states listed below (North Carolina for example).
Does your brewery hold a happy hour? Have you ever wondered how other breweries price during happy hour? There isn’t a ton of data for happy hour pricing for non-pint formats, so this is just the overall average pint data by state:
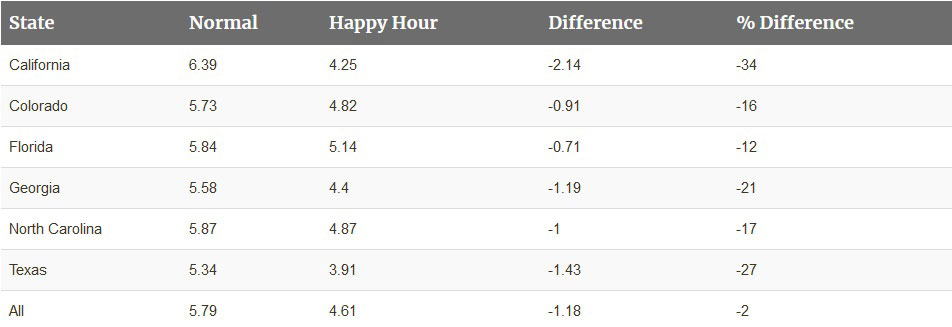
Again, this data has the problem that it may be showing apples to oranges – i.e. comparing the prices for beers that breweries are choosing to add to their happy hour menu against some that they aren’t.
There were 2,688 unique pint products+prices in the data. Of those, only 338 (12.6 percent) had a happy hour price. This means either breweries in those states aren’t doing happy hour or they are simply restricting which beers they offer. Those beers average $6.29 when not on happy hour (normal pricing) and $4.60 on happy hour. So the average discount is $1.69.
Interestingly, the average prices for those pints is actually higher than the overall average. Some of this may be data limitations. There are a bunch of pints with suspiciously low prices in the overall data, few of which are offered during happy hour.
In this case the median may be more instructive:
- Median price point pints (all beers) = $6
- Median price point pints (all beers offered for happy hour) = $6
- Median price point pints (happy hour) = $5
So the typical brewery is pouring pints for $6, the beers they offer for happy hour look like their overall pricing, and they typically discount a dollar. The averages change the story a bit, which is probably being pulled by a small number of beers that get huge happy hour discounts (now I really wish I knew locations!).
Taster Pricing
A final data point I was curious to delve into is taster pricing. The ability to try multiple beers is one of the top reasons that people say they visit a brewery, so it’s not surprising that tasters are one of the most common types in the data set. What I was most curious about was how brewers choose to price their tasters relative to their normal price. To do this, I looked at every beer that had a normal taster price. I then looked at two things:
- How that price varied depending on the other size(s) the brewery served that beer in
- What the price ratio was of taster to full pour
For the first question, of the 2,331 unique beers with taster prices, here are the average prices of tasters based on the other size(s) the beer is served in:
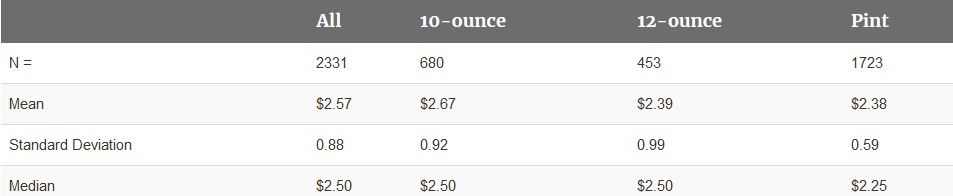
So taster prices were on average $2.57, but for beers served in 10-ounce formats, they were $2.67 (those beers are probably more likely to cost more per ounce), and they were only $2.38 on average for pints. I also added the standard deviation for prices. You can see that there is a bit more divergence on how breweries choose to price 10-ounce and 12-ounce tasters than on pints.
Next, I also looked at the ratio of prices for each format to tasters. I’m assuming here that tasters are 5-ounce pours. If breweries are coding other sizes to that “taster” slot, this analysis goes out the window.
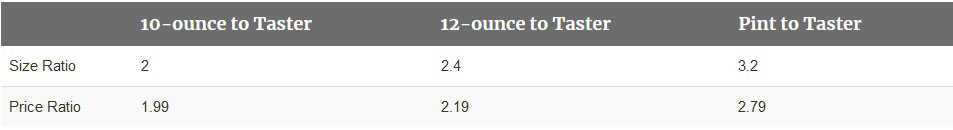
What the data show is that breweries more or less price tasters in line with the volume difference for 10-ounce pours, charge a bit more per ounce for tasters relative to 12-ounce pours (10 percent more per ounce), and charge even a bit more for tasters relative to pints (15 percent more per ounce). Alternatively, you can think about this in the reverse, that rather than charging “more” for tasters, breweries are giving volume discounts on 12-ounce and pint sizes.
That’s it for round one of diving into this new data set.
![]()
Beer CPA – “We Give Craft Breweries More Freedom and Peace of Mind”
A Craft Brewery CPA Firm that’s Tech Savvy, Responsive, and Business Smart.


Article Retrieved from Brewers Association, written By Bart Watson, October 9, 2019.
Photo Credit: Shutterstock